I completed the coursework about analysing voice differences between male and female subject in Signals and Systems in Psychology Fall 2020.
The course contains following requirements that should be achieved by MATLAB codes:
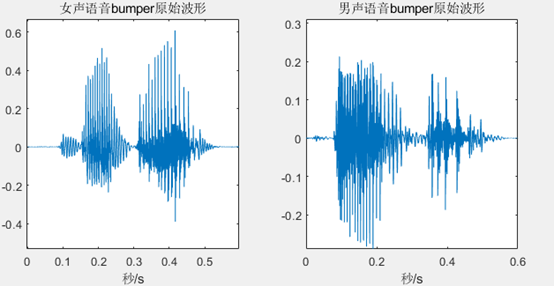
1.Draw the original waveform of given files* with time as the independent variable
2.Reasonable window and segment voice signals into different frames
3.Distinguish segments with voiced and voiceless sound.
4.Extract a frame to analyze the spectrum and determine the pitch frequency extraction strategy
5.Calculate pitch frequency
6.Compare the audio frequency characteristics of male and female students
* Recorded pronunciation of the word ‘bumper’ by a female student and a male student
%% read the file and resampling
[female0,~]=audioread('bumperFemale.wav');
[male0,fs0]=audioread('bumperMale.wav');
female=resample(female0,9000,22050);
male=resample(male0,9000,22050);
fs=9000;


%% Draw the original waveform of given files* with time as the independent variable
figure;
subplot(1,2,1);
plot([1:13230]/fs0,female0);
title('女声语音bumper原始波形');
xlabel('秒/s');
subplot(1,2,2);
plot([1:13230]/fs0,male0);
title('男声语音bumper原始波形');
xlabel('秒/s');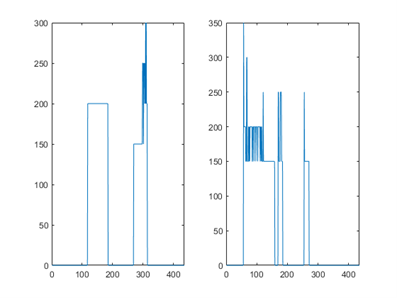
%% Reasonable window and segment voice signals into different frames
N=180;%setting window size as 20s
dw=N/15;


%% Distinguish segments with voiced and voiceless sound.
Enfemale=[];
Enmale=[];
for i=1:dw:length(female)-N
    Enfemale=[Enfemale,sum(female(i:i+N-1).^2)];
end
for i=1:dw:length(male)-N
    Enmale=[Enmale,sum(male(i:i+N-1).^2)];
end
plot(Enmale);
plot(Enfemale);

%%Extract a frame to analyze the spectrum and determine the pitch frequency extraction strategy
figure;
ffemale0_all=[];
for i=1:dw:length(female)-N
    if sum(female(i:i+N-1).^2)>1
        f0=find_f0(female(i:i+N-1),fs,N);
        ffemale0_all=[ffemale0_all,f0];
    else
        ffemale0_all=[ffemale0_all,0];
    end
end
subplot(1,2,1);
plot(ffemale0_all);
fmale0_all=[];
for i=1:dw:length(male)-N
    if sum(male(i:i+N-1).^2)>0.7
        f0=find_f0(male(i:i+N-1),fs,N);
        fmale0_all=[fmale0_all,f0];
    else
        fmale0_all=[fmale0_all,0];
    end
end
subplot(1,2,2);
plot(fmale0_all);

%% Calculate pitch frequency with fft
function f0=find_f0(y,fs,N)
Xw=fft(y,N);
[p,~]=global_max_find(abs(Xw(1:N/2)));
k0=min(p);
f0=k0*fs/N;
function [position,value] = global_max_find(ft)
len=length(ft);
position=[];
value=[];
for k=2:len-1
    if ft(k-1)<ft(k)&&ft(k+1)<ft(k)
        position = [position,k];
        value = [value,ft(k)];
    end
end
end